
It seems on a regular basis we are exposed to unbelievable investment success- not through a grocery store encounter with Warren Buffett, but from your friend or neighbor at a cocktail gathering.
We’ve all been there. Someone sharing how one of their investments has exploded in value, and how they were soooo smart in buying it. Even as a financial advisor, I get to be part of this type of conversation. Not that it is really a conversation, more like a one way, “I’m the smartest person in the room” braggadocio. Yes, they may have hit a good one, but what you never do hear about are the ones that didn’t work so well.
It makes sense for individuals to want to be successful at the investing process. Who doesn’t want more money to meet their goals and dreams? We all do.
But most of us know to be skeptical of an email from unfamiliar African royalty, suggesting that you are now the beneficiary of a huge windfall. Most of us know that “something too good to be true”, really is untrue. Evidence shows that “perfect stock selection” and “market timing” fall into the “too good to be true” camp.
For example, Dalbar shows once again in its 23rd annual report, that investors tend to put money in and out of the investments based on their emotions, and not solid research for long-term investing.
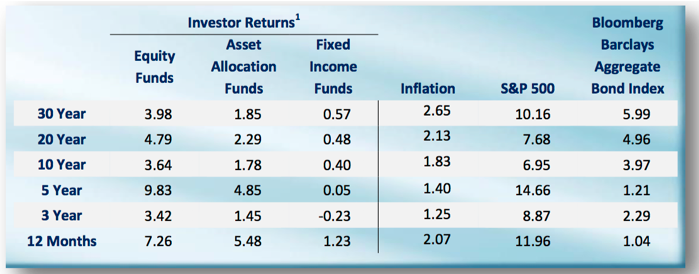
Just take a look at the table above and compare the column labeled “Equity Funds” under “Investors Returns” to the S&P 500 column. The difference between the two is the amount investors left on the table from their decisions regarding, “is it a good time to be invested now”.
Investors left at least 2.89% on the table per year over a 20 year period, and 6.18% over a 30 year period. With all the information in the marketplace, have investors gotten smarter? Apparently not, looking at the three, five and ten year numbers.
So… should investors simply invest in the S&P 500 and let it ride? That strategy is better than making emotional decisions, for sure! That being said, this is a “point to point” analysis. In other words, the deposits AND withdrawals also matter. Often, I use the Rip Van Winkle analogy. If you simply put money away, go to sleep for 10 or 20 years, you will likely wake up and be happy. Wow! How the portfolio has grown!
Rip van Winkle didn’t care about volatility. The last 15 years have seen the largest and most dramatic dives in the market. If one could truly ignore what’s going on around them, they would wake up and be happy with the outcome in 2017. Yet, that is not the world we live in. Our brains have been hardwired to flee from danger, prompting us to to make decisions that are not in our best interests.
Volatility matters! It matters in how we react to it, and how we use money from our portfolio. After all, our investment portfolios grew from our own decisions to delay gratification today to use the funds in the future.
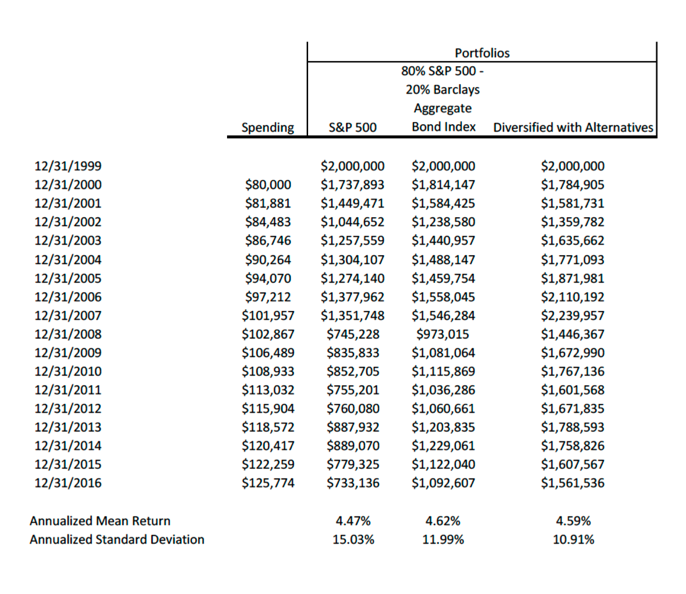 The chart above uses the last 16 years as the time frame. As mentioned above, this includes two of the most dramatic pulldowns in stock market history. The spending column starts at $80,000 per year and is inflated each year to reflect a real person’s need to adjust withdrawals to maintain their standard of living.
The column entitled S&P 500 is the index. It is not adjusted for fees and would need to be, since you can only invest in ETF’s and Index Funds to replicate.
The return shown at the bottom is the “dollar adjusted” rate of return. This is different from a “point to point” look, as it is adjusted for the cash flows out of the strategy. Beneath the return, is the standard deviation of the S&P 500. It is simply a measure of the ups and downs of the strategy. I sometimes refer to it as the wiggle factor. The larger the number, the more the strategy moves up and down or “wiggles”.
The next column, entitles 80% S&P 500 and 20% Barclays Aggregate Bond, helps us see that the real issue for people who use their portfolio is volatility, measured by standard deviation. Note that the ‘spending’ level is the same. Note also, the return is not much different. 4.47% versus 4.62%.
Note further that the balance of the portfolio is 49% larger than the S&P 500 column. $359, 471 more dollars to meet current and future needs. The real difference is standard deviation, the measure of volatility, which is lower by 25%. 15.03% versus 11.99%. Volatility matters a great deal for real people with real portfolios being used.
The last column adds some non-traditional investments. The impact reduces volatility even more. Note that this column has more than double the amount of money that the S&P 500 column shows.
Simple message, done’t be fooled by point to point returns. They don’t tell the real story about how your portfolio will impact your life.
It is often much better to focus on the Sharpe Ratio of a strategy to ascertain how it will work for you longer term than simple point to point returns. There are many possibilities that are impossible to account for in our lives. Having portfolio’s that shelter you from the unexpected is vital and the tools are available to help.
As investors, it is important to recognize how we are hard-wire as humans and how our emotions play into our decisions. Through proper design and using the right tools, success is achievable. Just look outside the box that the financial service marketers want to show.
Some more resources to review include one by Jason Zweig, author and columnist for the Wall Street Journal. He recently wrote an article that furthers some thoughts on the topic.
Another paper that many have found compelling is one by Vanguard on the value that more minds can have on helping people achieve the results they want to achieve.
Warren Buffett has been quoted as saying “Investing is simple, but it is not easy’. He recognizes that there is a natural, very human pull, to do the wrong thing at the right time. The evidence supports that. If you would like the full Dalbar report let us know, and we can email you the PDF.
White Oaks recognizes the human element and the has studied the evidence, vetted via the academic process. Following the evidence and resisting how we are hardwired as human beings emphasizes the SIMPLE, and assures better futures.